Dashboard
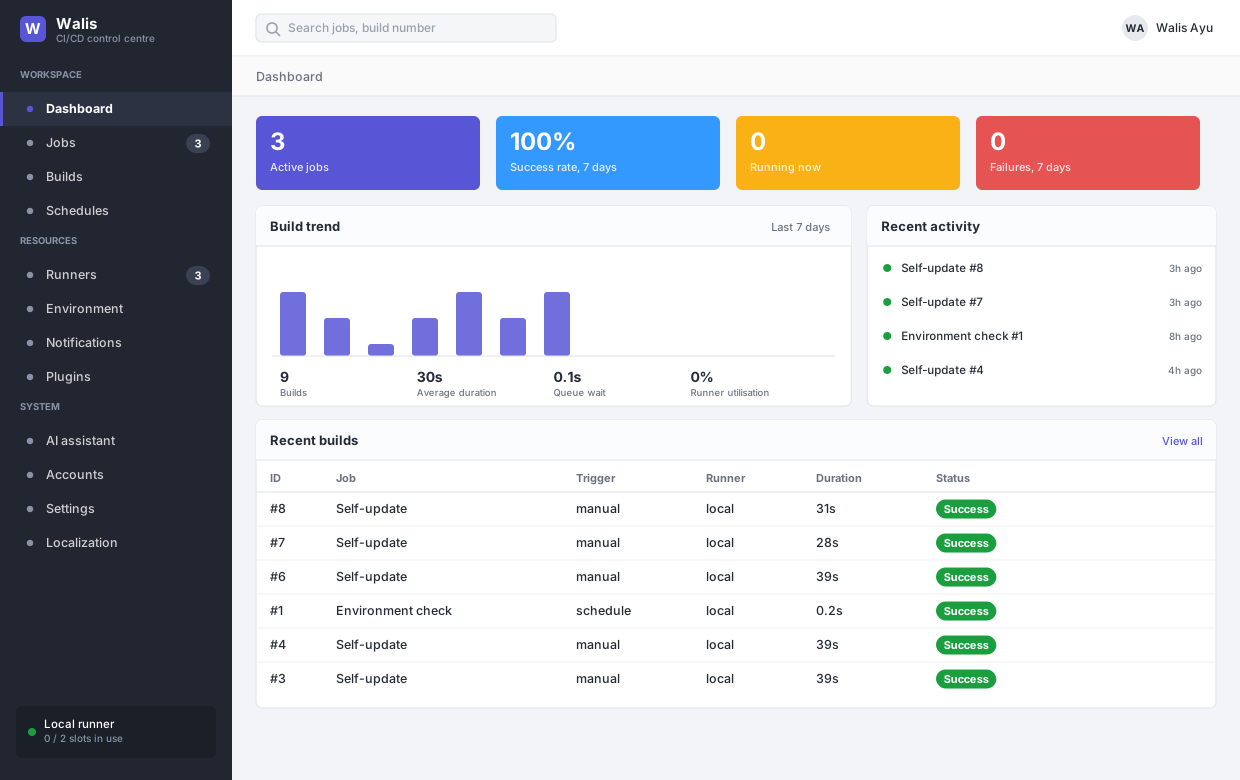
The landing screen. Everything here is derived from the build history — there is no separate metrics store to keep in sync.
The four tiles
| Tile | Means |
|---|---|
| Active jobs | Jobs that are enabled. Paused jobs are excluded. |
| Success rate, 7 days | Successful builds ÷ finished builds over the last seven days. Running and queued builds are not counted. |
| Running now | Builds currently executing, across every runner. |
| Failures, 7 days | Finished builds that failed. A build that was cancelled is not a failure. |
Build trend
Seven daily columns, with four figures underneath:
- Builds — how many finished in the window.
- Average duration — mean wall-clock time of finished builds.
- Queue wait — mean time between a build being queued and a runner picking it up. A number that climbs while the machine is otherwise idle usually means the concurrency limit is too low, or the build is pinned to a runner that is offline.
- Runner utilisation — occupied slots ÷ total slots.
Recent builds and activity
The table is the same data as Build history, truncated. Clicking a row opens the build output. The activity column beside it is the same events in a narrower form, for scanning.
Runner load shows slots in use per runner; success rate by job ranks jobs by how often they finish green, which is the fastest way to spot the one job that has been failing quietly for a week.
Metrics for something else
If you want this in Prometheus rather than a browser, scrape GET /metrics. It sits outside/api, so the scraper does not need a key — job counts, queue depth, builds by status, average duration and queue time, and runner state.